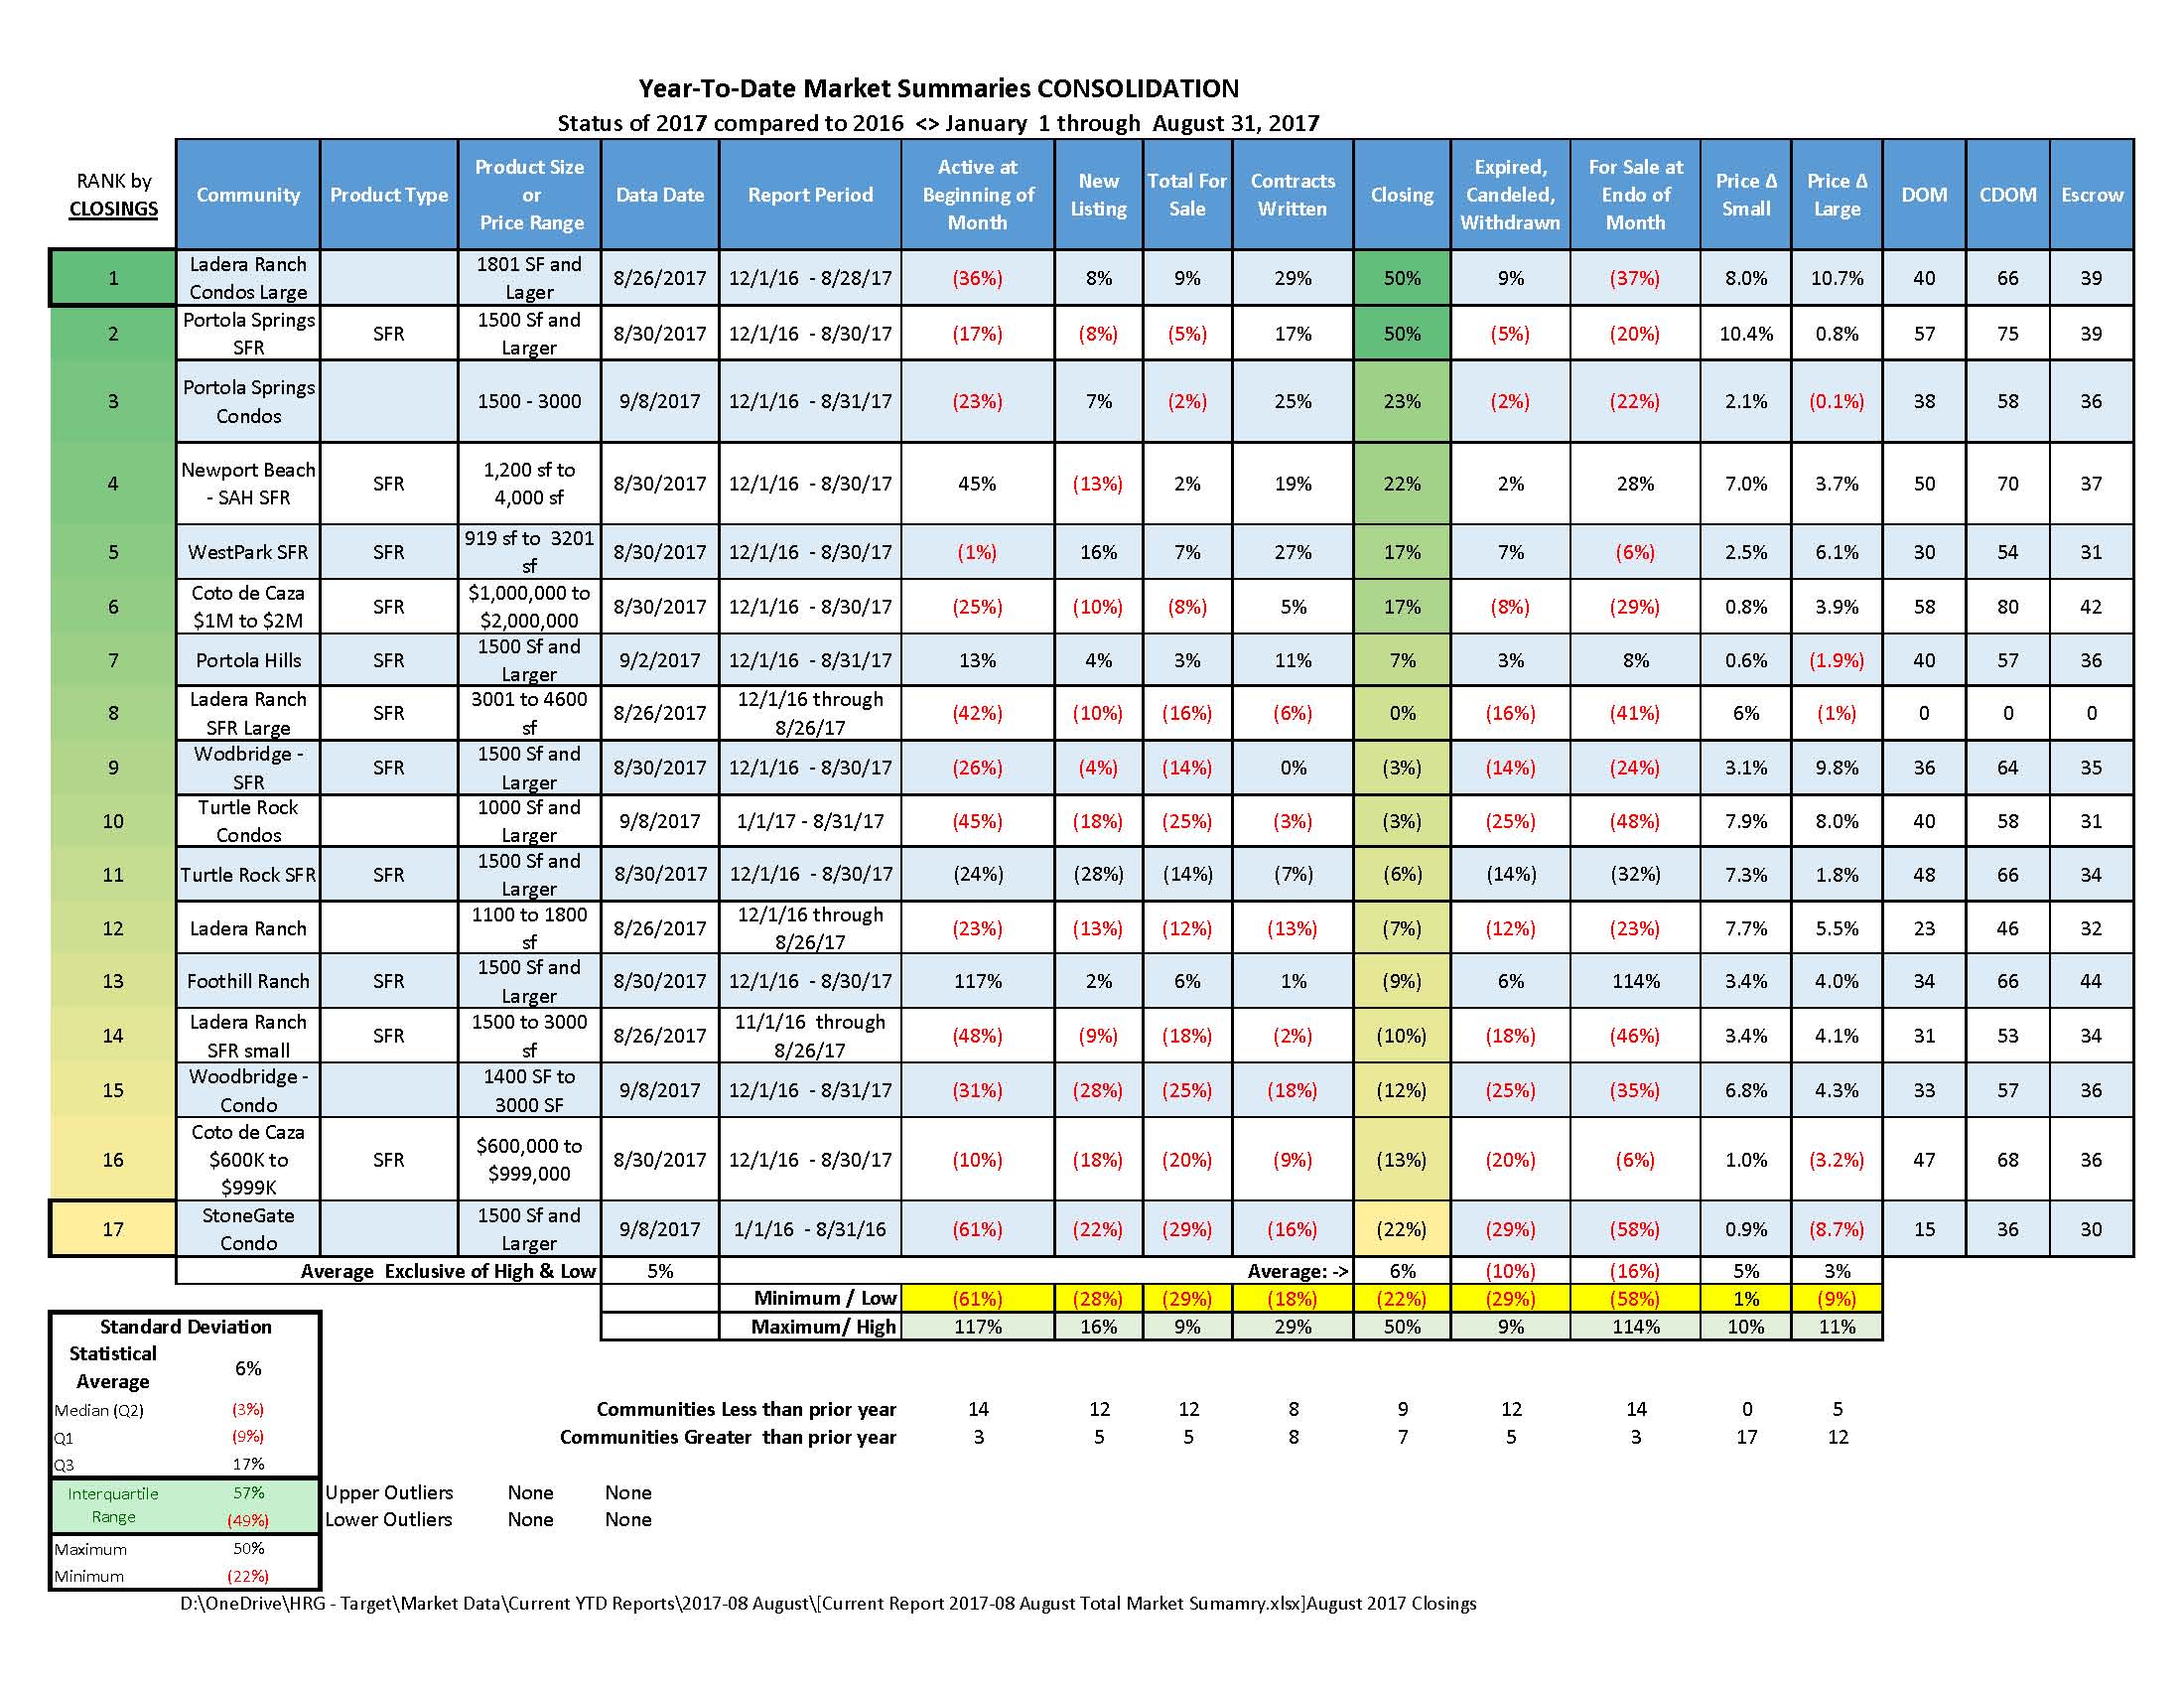
Home Inventory Down 26% Year-Over-Year
2017 Q-3 Market Activity as of August 31, 2017
We monitor communities from Newport Beach to Ladera Ranch. This report covers 10 neighborhoods broken down into 17 product/market segments.
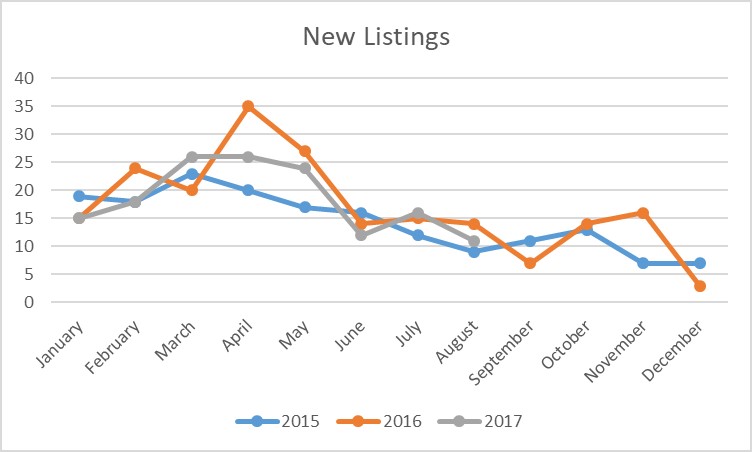
THREE YEAR GRAPH SAMPLE
(Woodbridge SFR)
The Neighborhoods and Product Segments:
We have chosen these neighborhoods because they represent a vein or continuous line of average home types and are within 20 minutes of our base of operations so we can effectively service our customers.
This report, our standard for tracking year-over-year market activity, uses the following neighborhoods. Each is a link to the specific neighborhood market report:
- Newport - West Bluff / Santa Ana Heights.....SFR (single family residential)
- Irvine - Turtle Rock.........SFR 1500 sf & larger
- Irvine - Turtle Rock.........Condo 1100 sf & larger
- Irvine - Woodbridge........SFR 1500 sf +
- Irvine - Woodbridge........Condo 1400 sf +
- Irvine - WestPark............SFR 900 to 3200 sf
- Irvine - StoneGate...........Condos 1500 sf +
- Irvine - Portola Springs....SFR 1500 sf +
- Irvine - Portola Springs....Condo 1500 - 3000 sf
- Foothill Ranch.................SFR 1500 sf +
- Portola Hills....................SFR 1500 sf +
- Coto de Caza...................SFR $600,000 to $999,000
- Coto de Caza...................SFR $1,000,000 to $2,000,000
- Ladera Ranch .................Condo 1100 to 1800 sf
- Ladera Ranch..................Condo 1801 sf +
- Ladera Ranch..................SFR 1500 to 3000 sf
- Ladera Ranch..................SFR 3001 to 4650 sf
We maintain or have past data on about 32 neighborhoods.
We
can develop a report for any neighborhood in California.
Purpose:
The primary function of this report is to give an impression of Supply and Demand
SUPPLY is defined herein as the number of Active Listings at the Beginning of a month, plus the number of New Listings generated during the month. This sum totals the Total for Sale during the month. Effectively these are the 'willing' sellers.
DEMAND is defined as the number of Contracts Written plus the number of Closings. Subtract that sum plus any Expired, Canceled or Withdrawn listings from the Total for Sale to produce the Active Listings at the End of Current Month which is effectively the Active at Beginning Of (the next) Month.
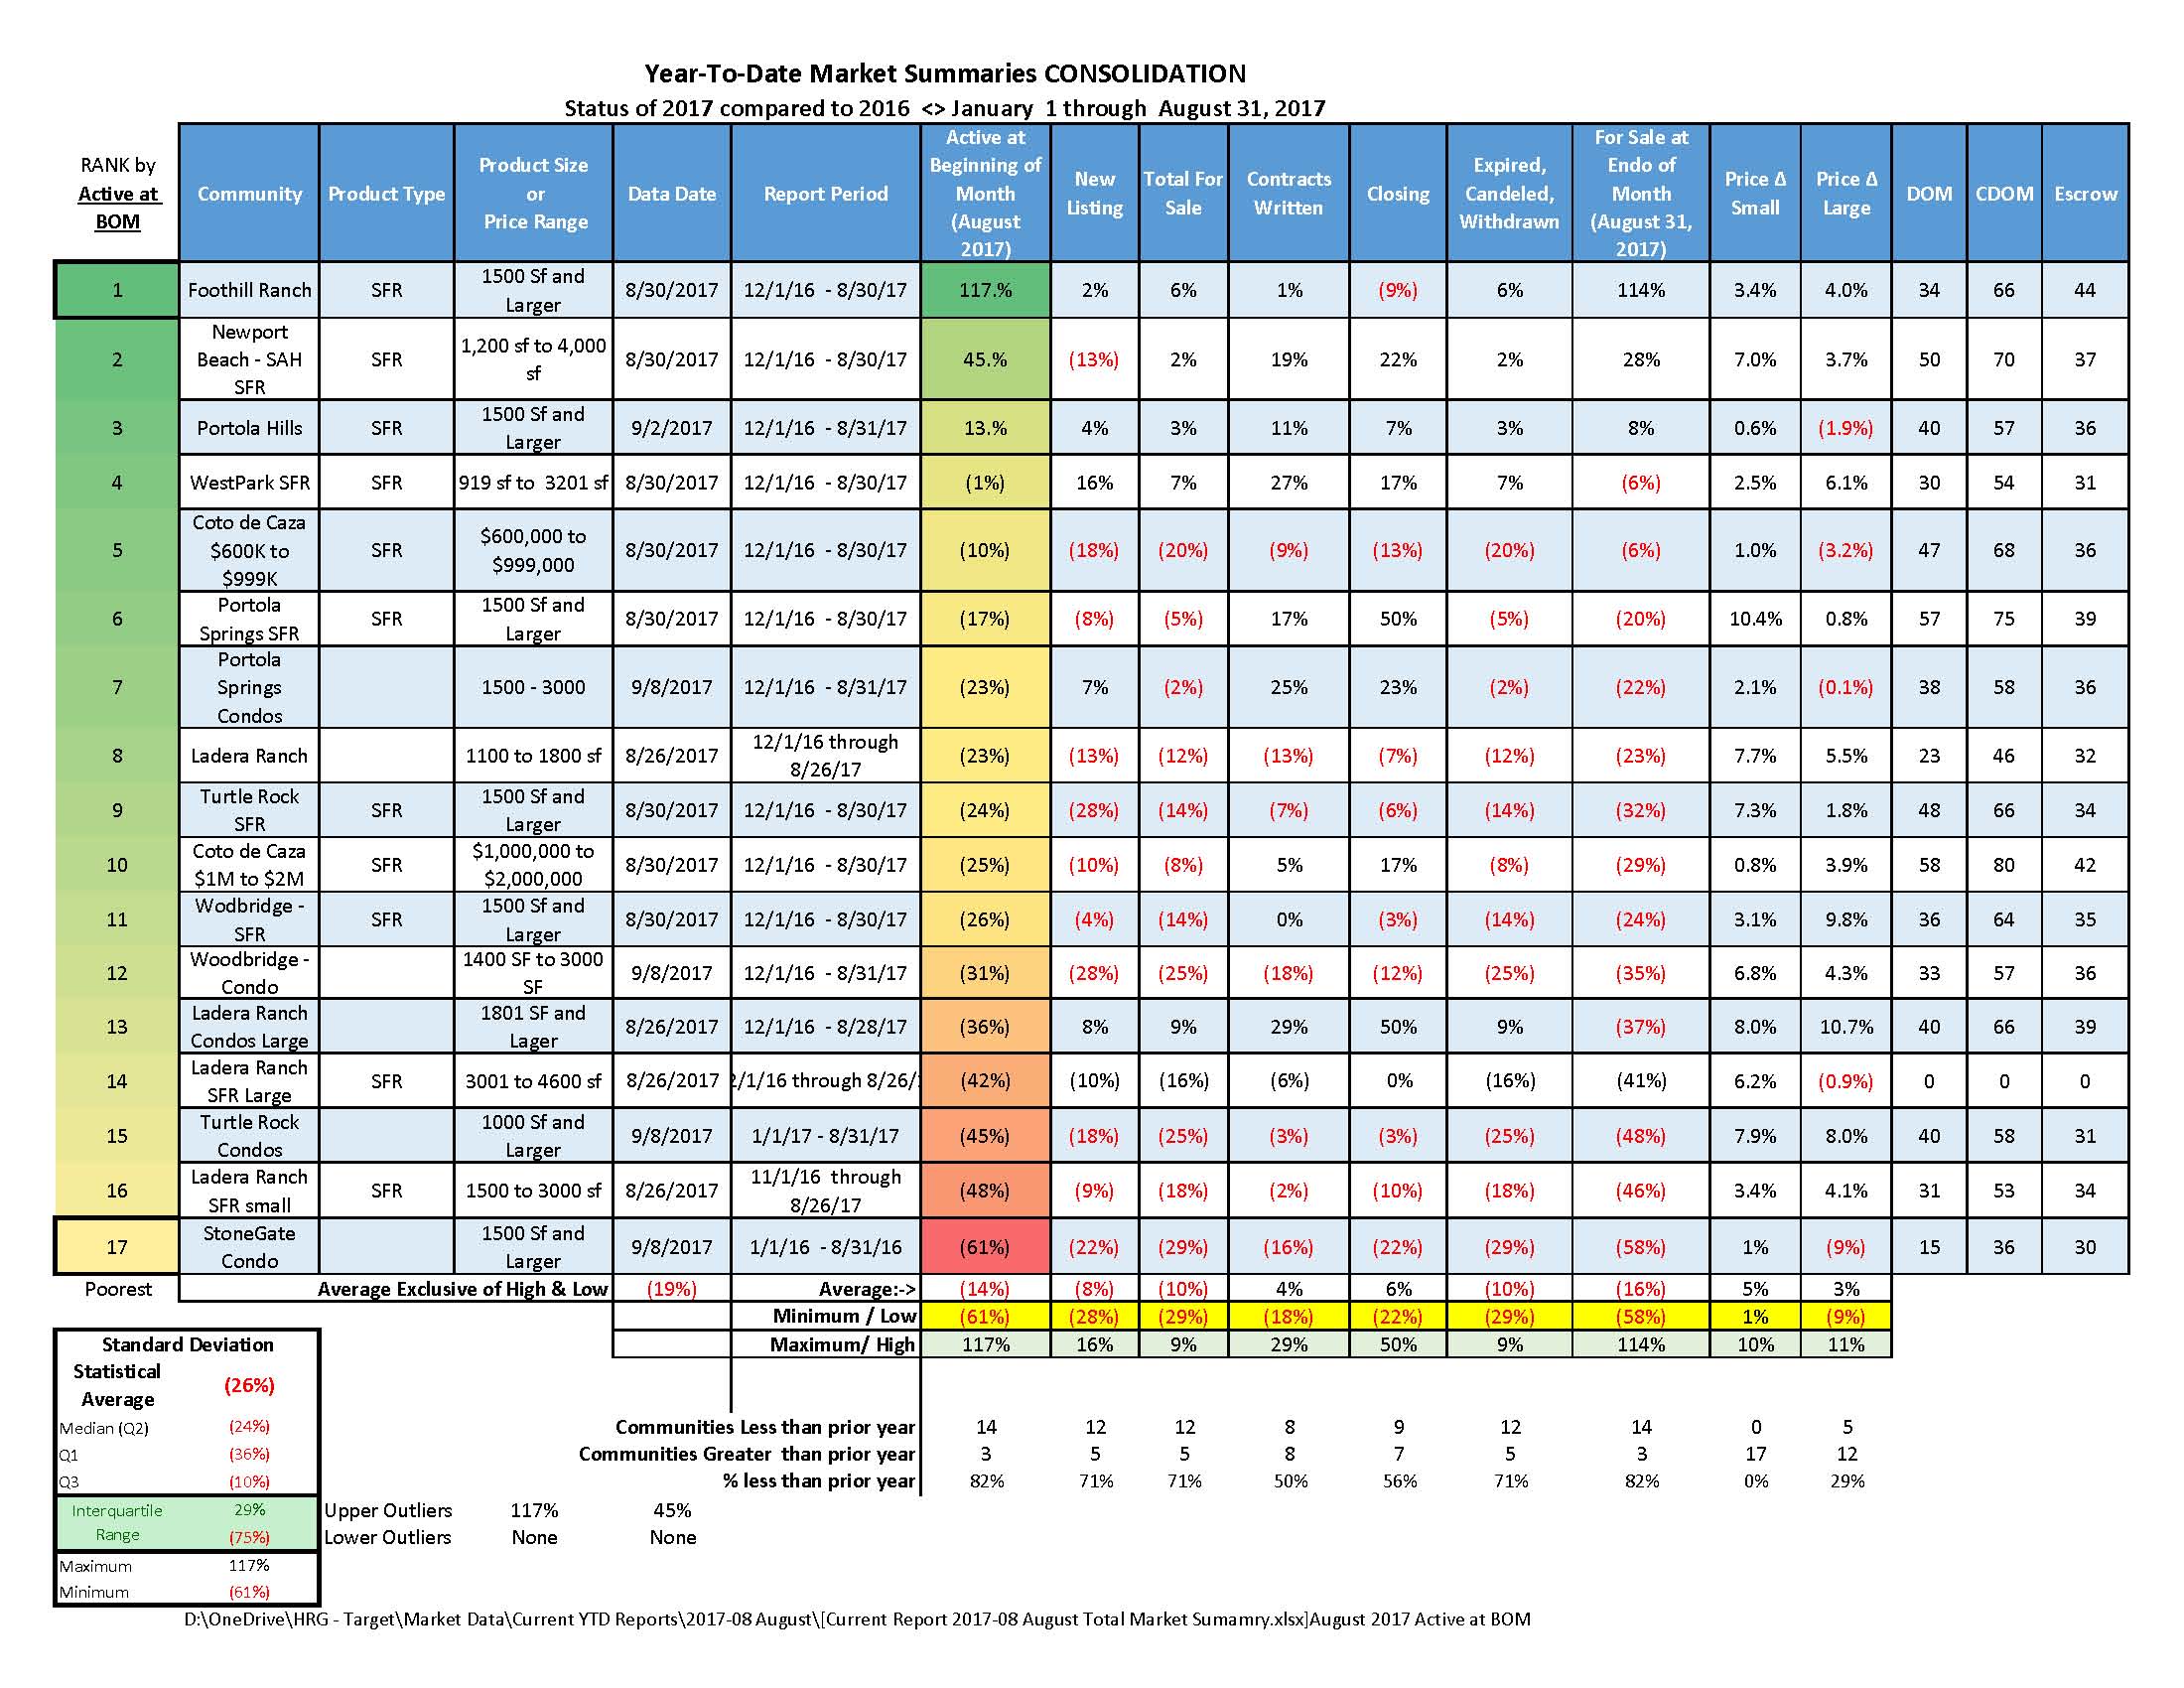
Results / Status / Summary for August 2017 compared to August 2016
- Active at Beginning Of Month: (26%) - down 26%
- New Listing: (8%) - down 8%
- Contracts Written: 4% - up 4%
- Closings: (24%) - down 24%
- Active at End Of Month: (24%) - down 24% as compared to the end of August 2016
This is an improvement of 5% in the market from June of 2017, our last report, when the Active and the end of June was down 29% from the prior year.
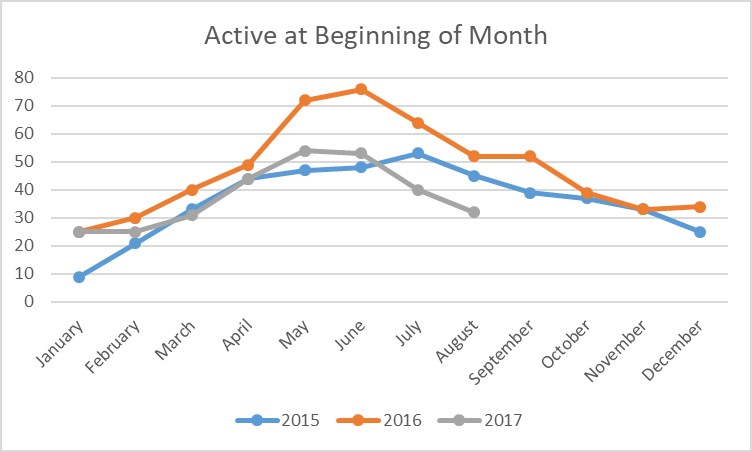
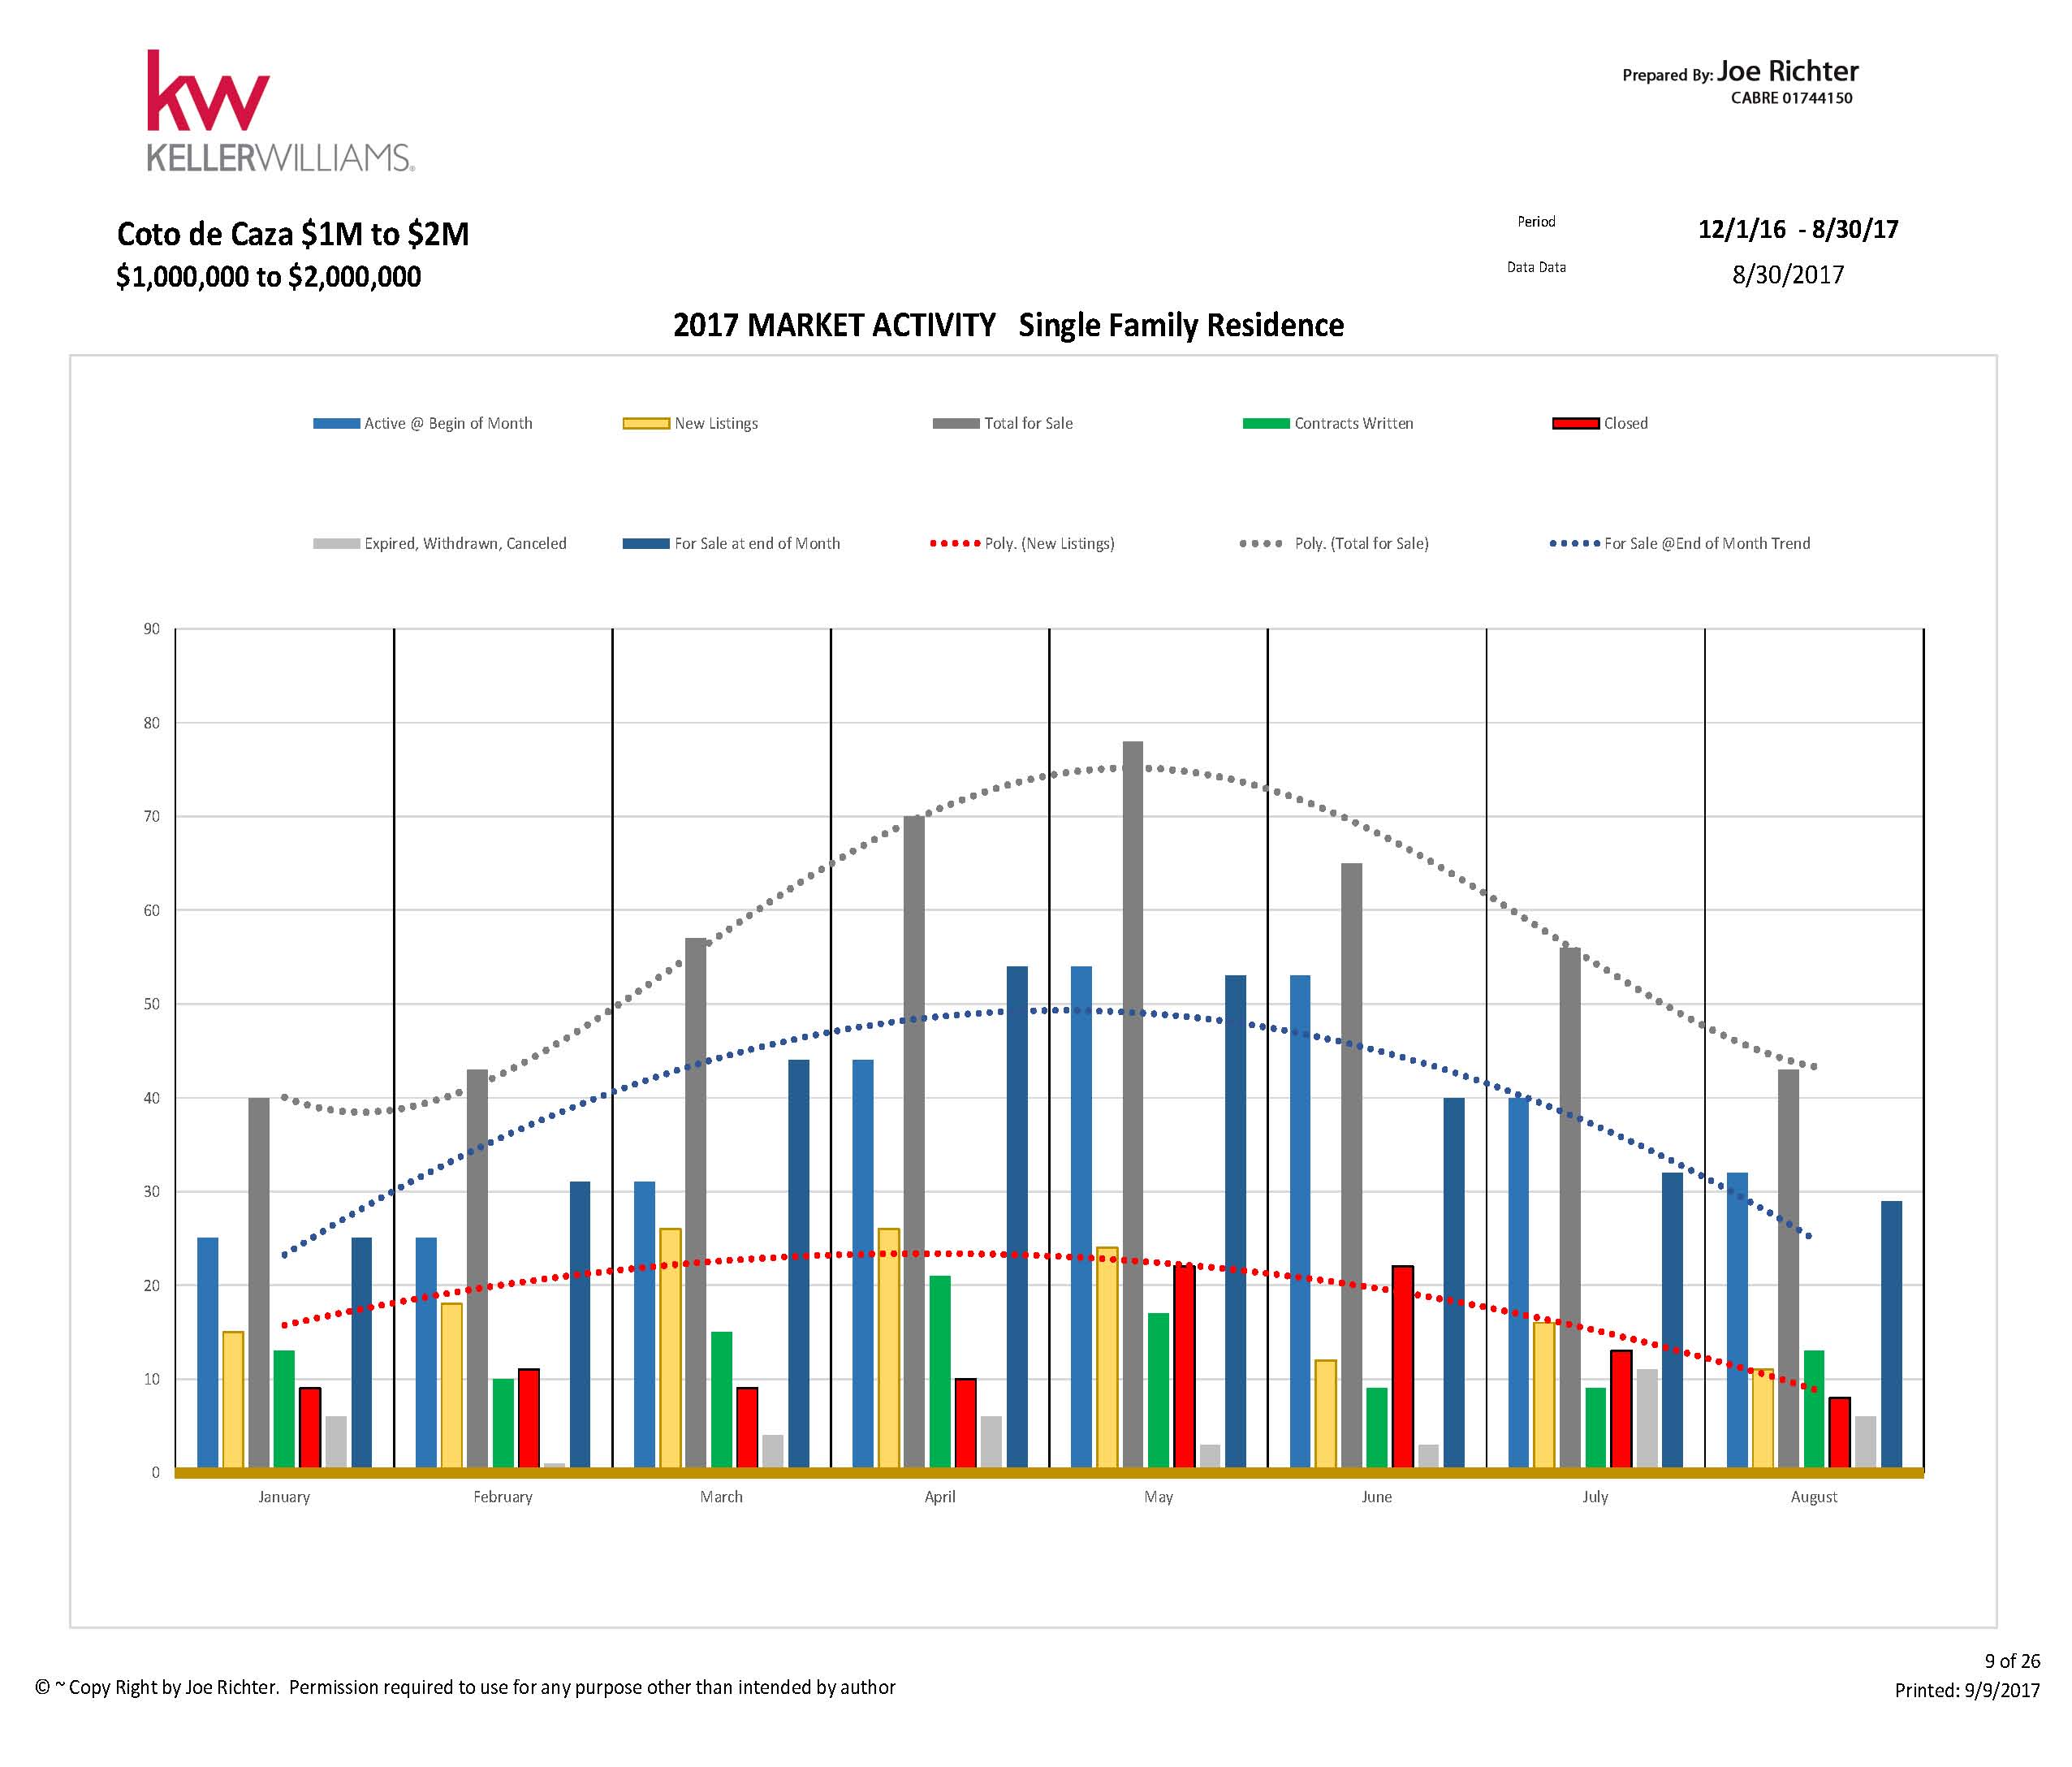
Year-To-Date Activity Graph Sample
(Coto de Caza)
Orange County Market Summary Report for August 2017 with Community Ranking
ACTIVE at BEGINNING OF MONTH (BOM)
Community Ranking
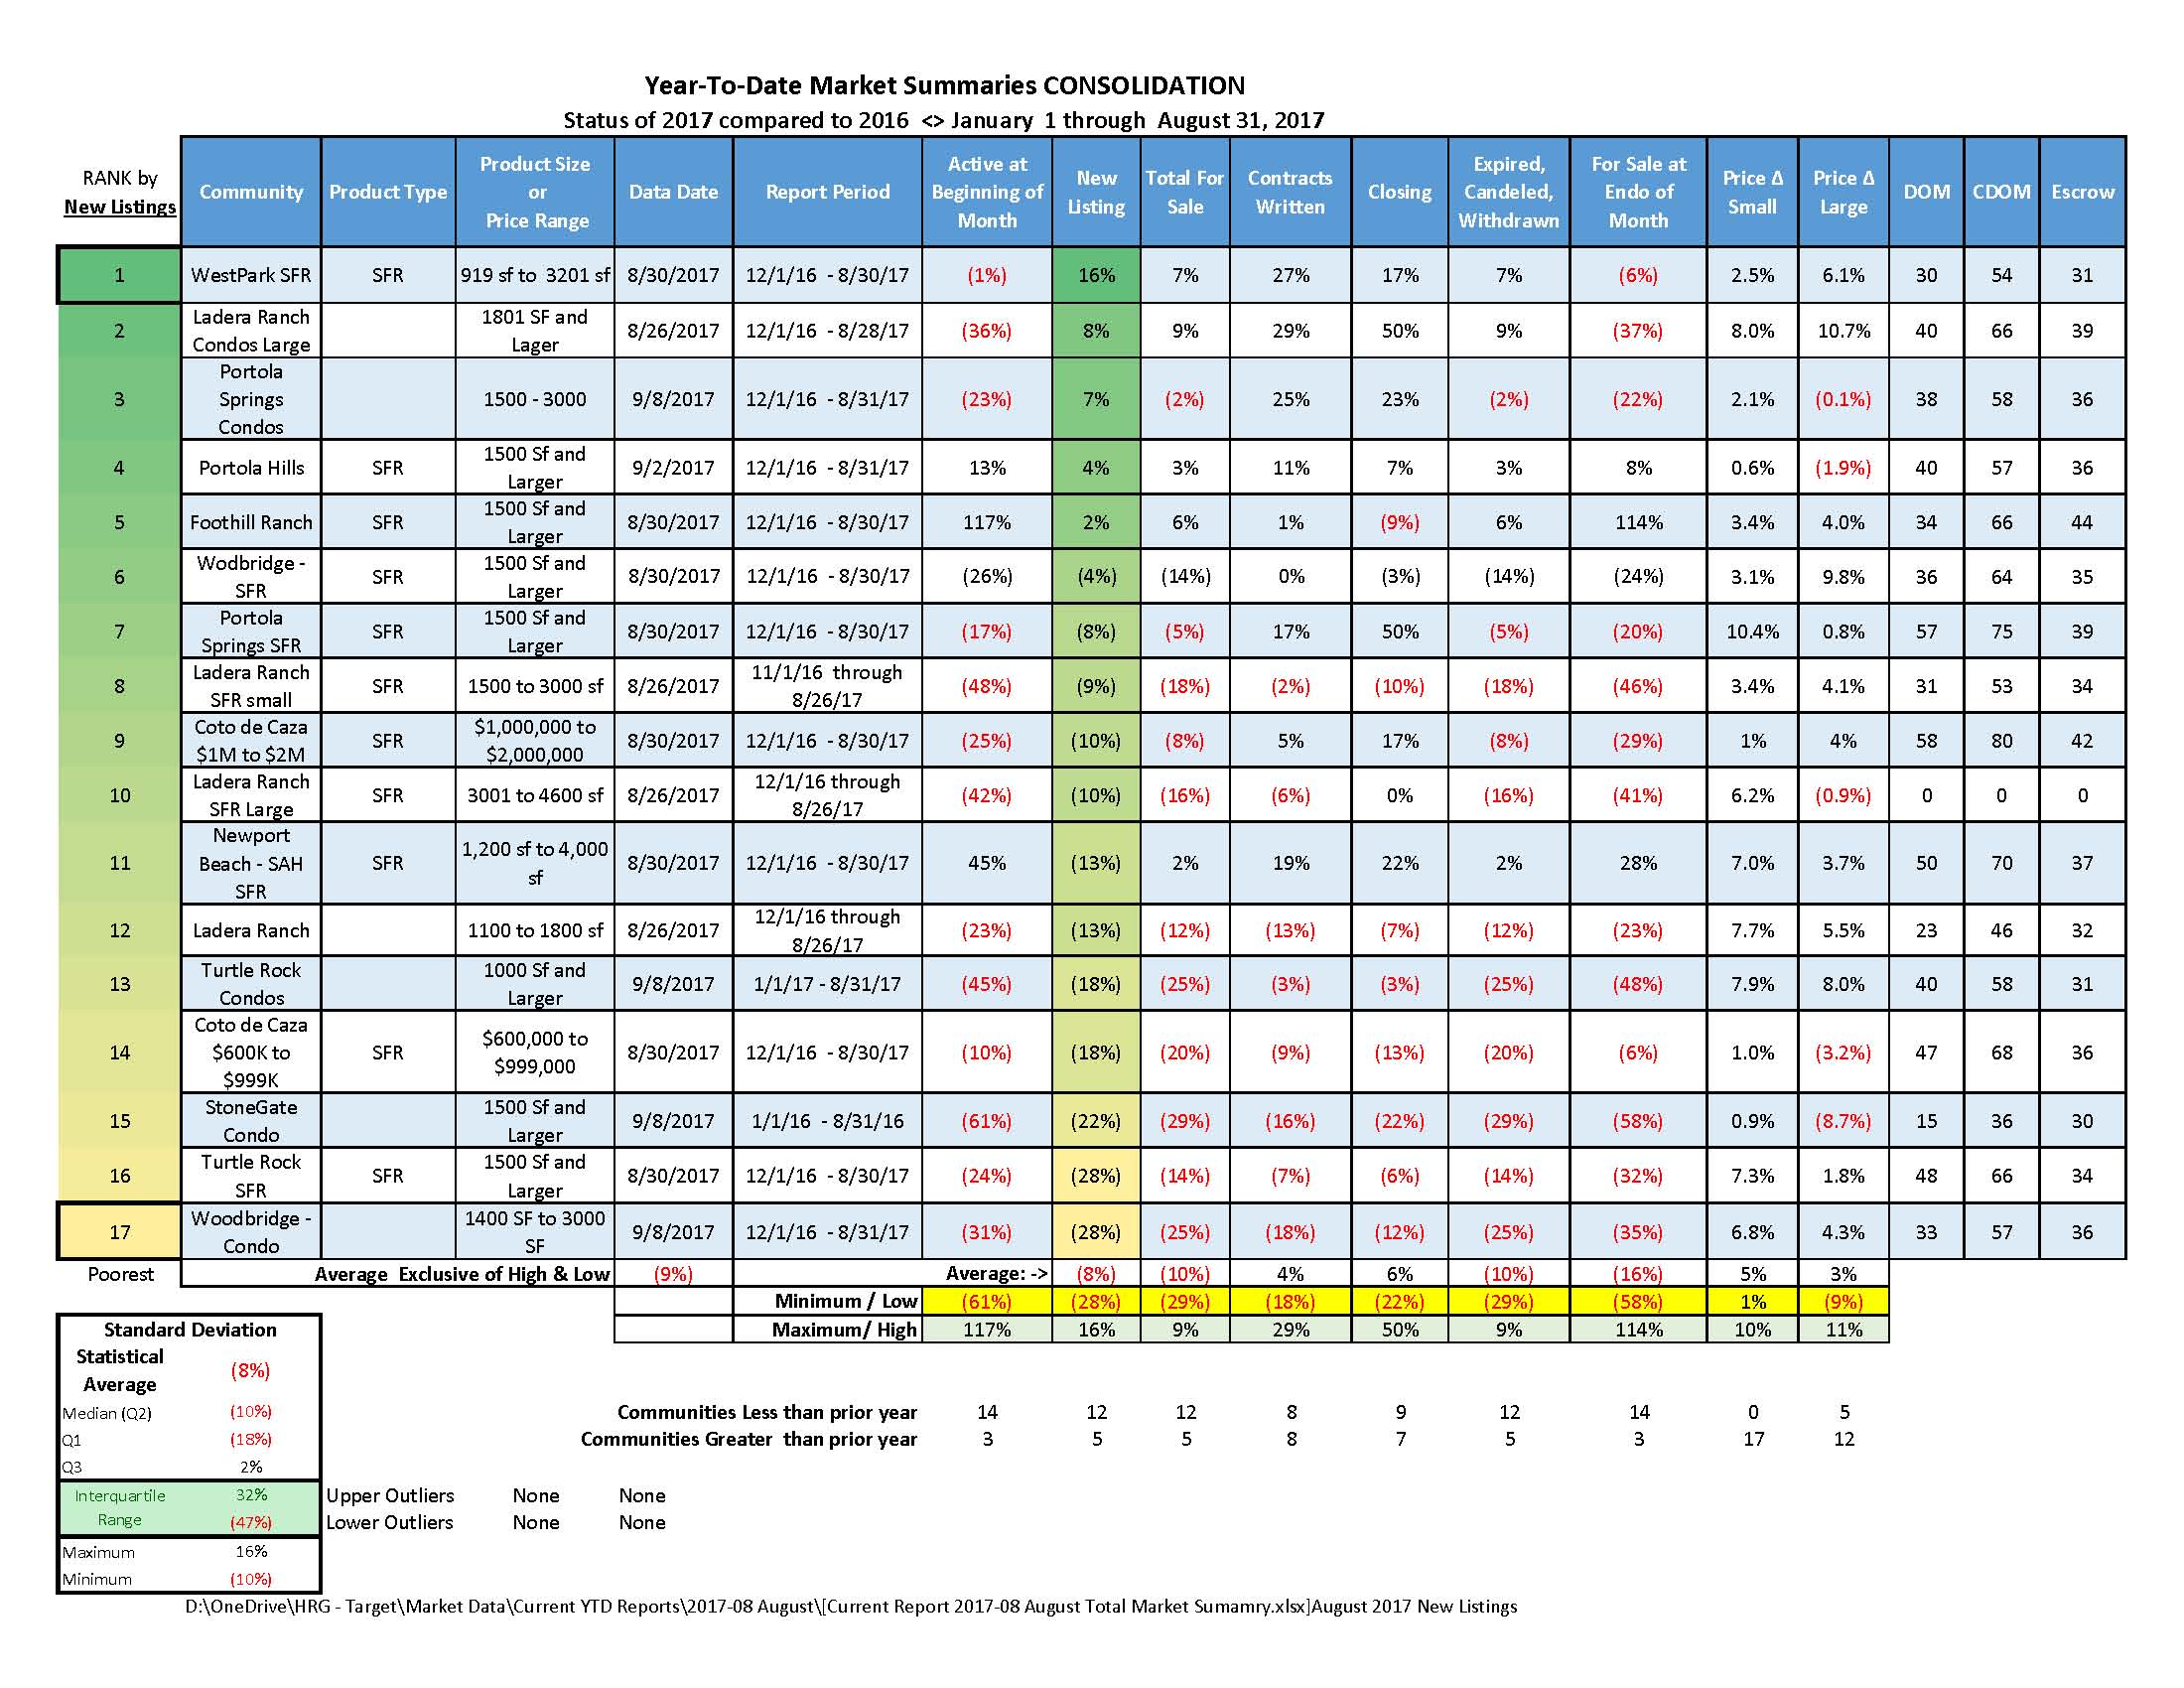
NEW LISTINGS
Community Ranking
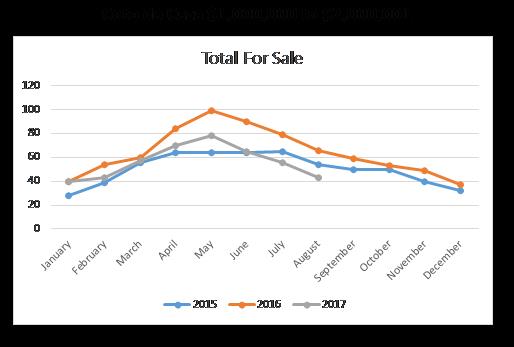
TOTAL FOR SALE
Community Ranking
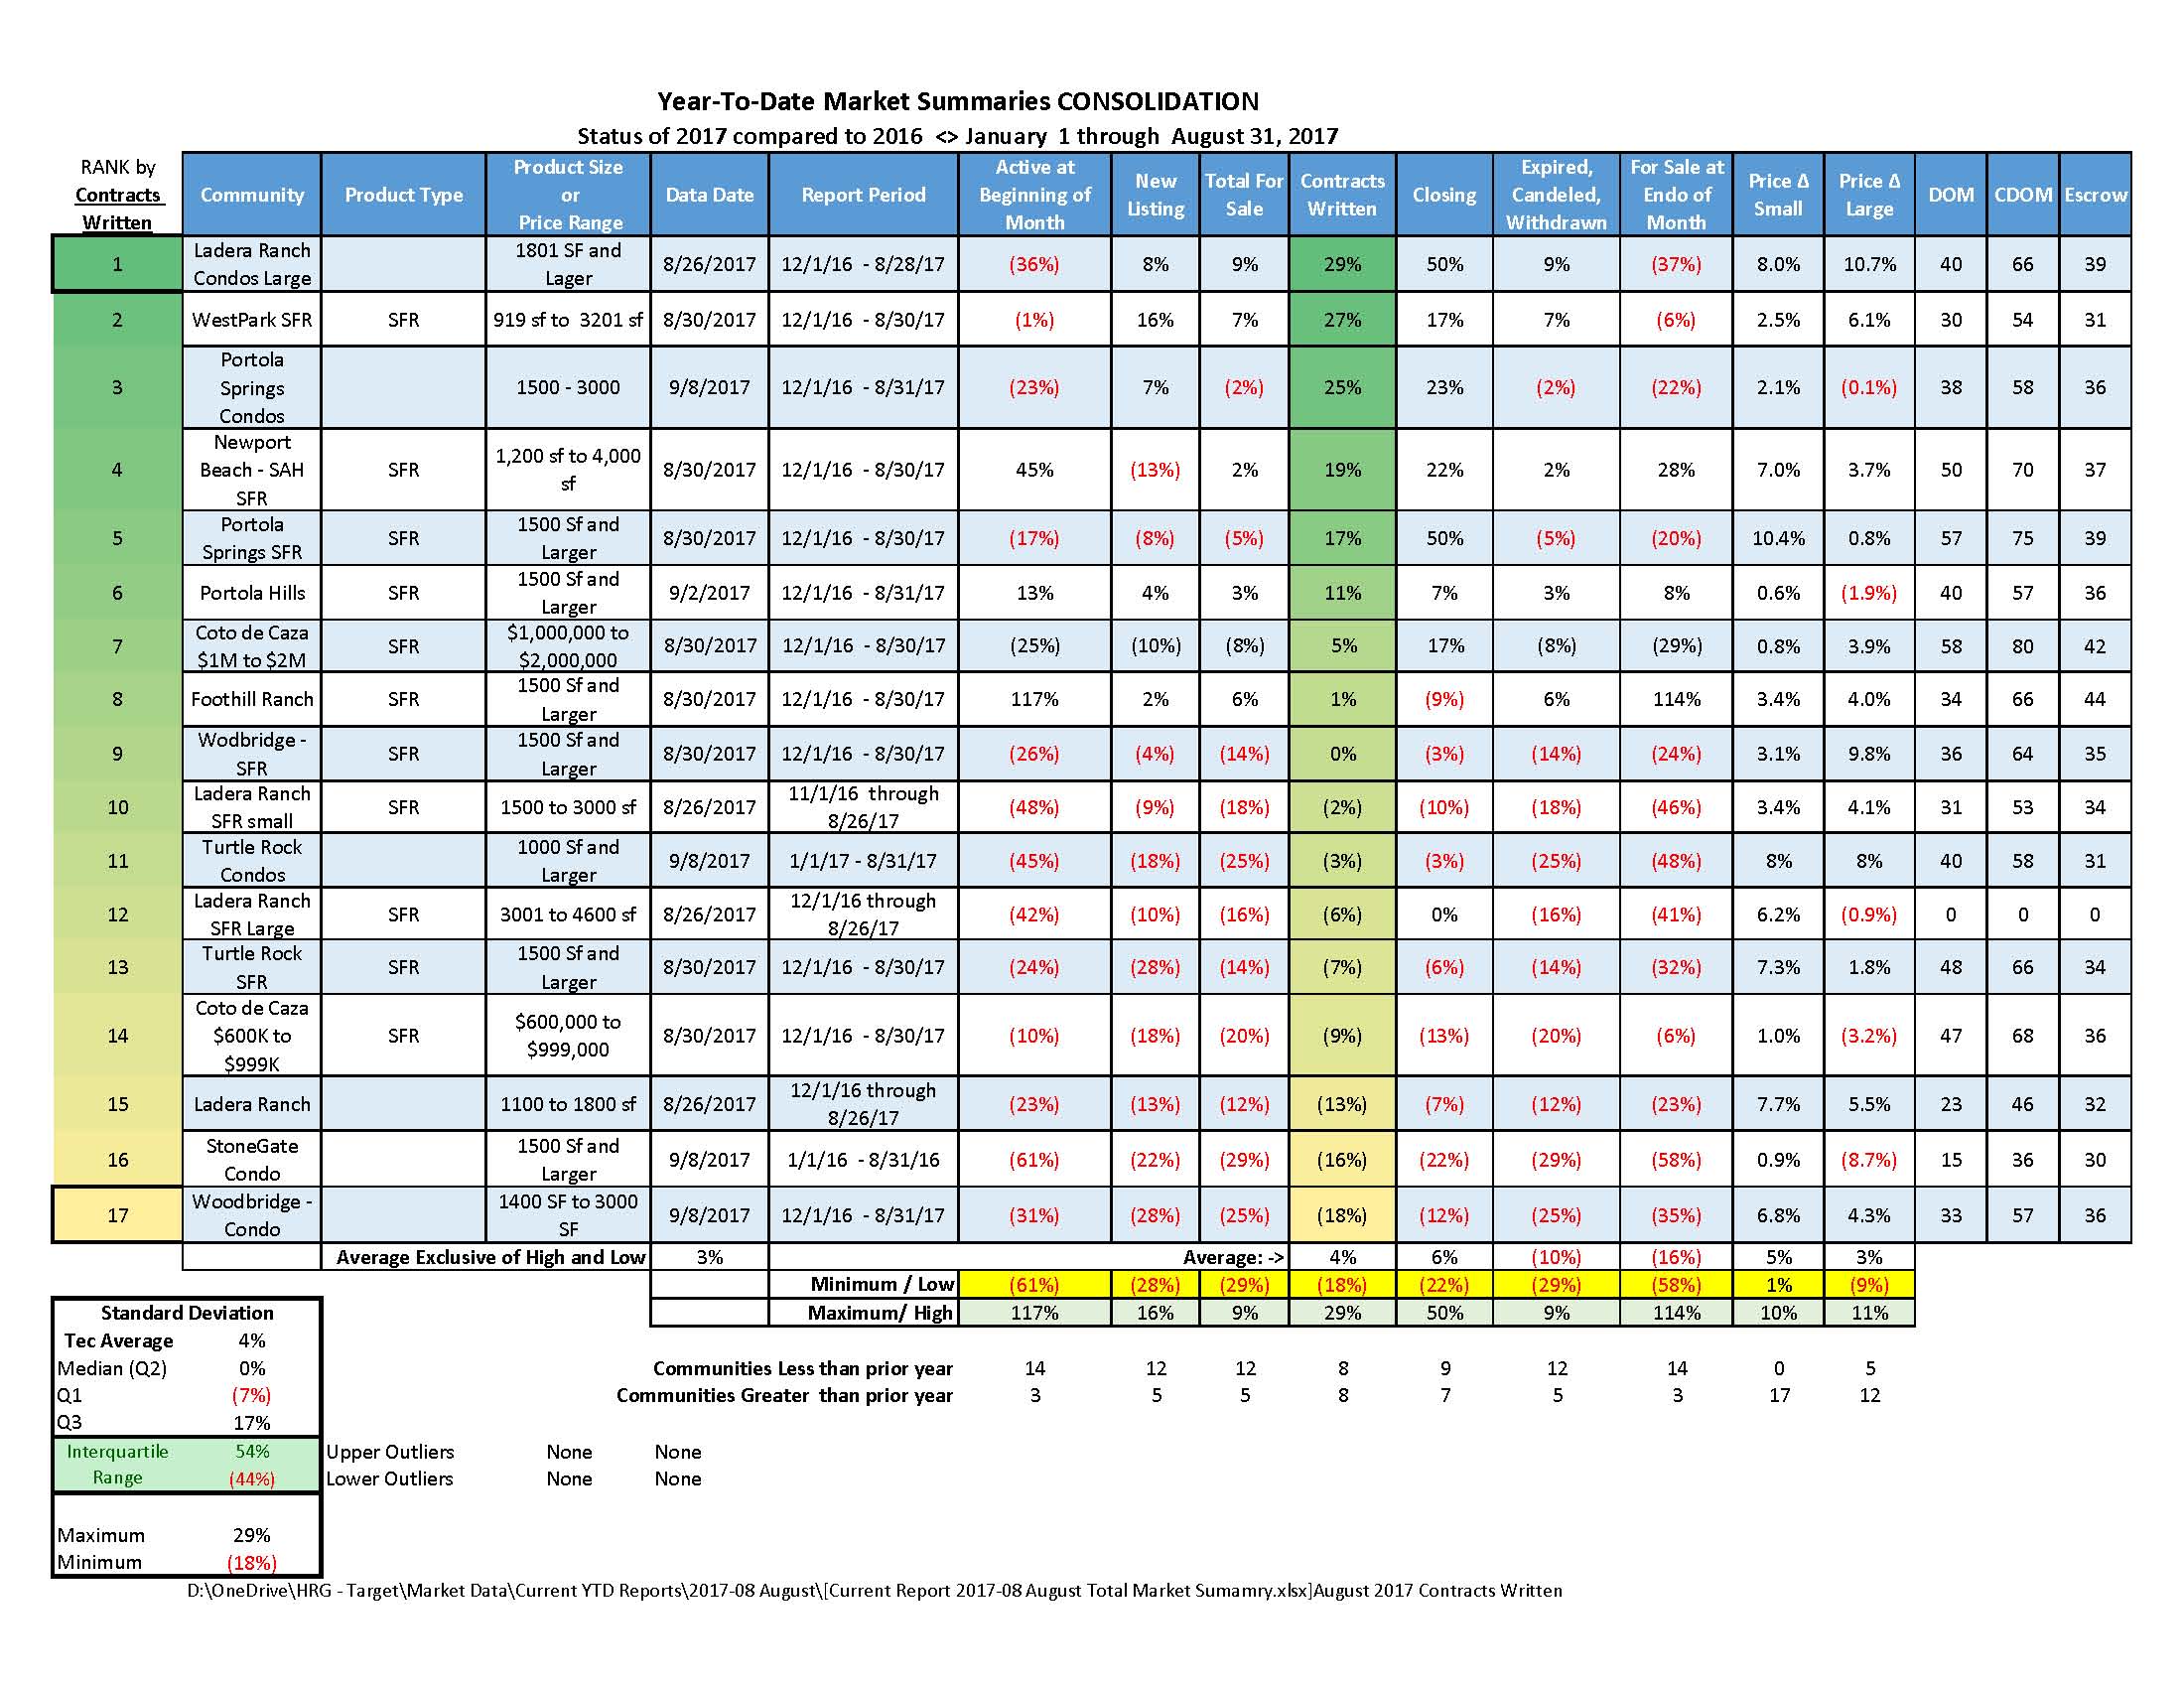
CLOSINGS
Community Ranking